MONDAY, JUNE 15, 1970 THE LEADER - HERALD, GLOVERSVILLE - JOHNSTOWN, N. Y.
Gale Sondergaard Brightens Scene On Daytime Drama by Harvey Peck
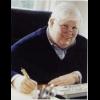
NEW YORK - One of Hollywood's all-time great supporting actresses Gale Sondergaard has joined the ever growing roster of film actresses brightening up the daytime drama scene. Gale, along with Geraldine Fitzgerald and former child star Patty McCormack ("The Bad Seed") stars in ABC's serial "The Best of Everything." Miss Sondergaard actually set the standards for supporting performers when she walked away with the first Oscar awarded in that category for "Anthony Adverse." 5ome years later she was nominated for her truly memorable portrayal of King Rex Harrison's first wife in "Anna and the King of Siam." "I love television," says Miss Sondergaard, a charming, loquacious lady who outwardly shows no scars from the ordeal of almost 20 years of blacklisting by TV and motion pictures following a Congressional investigation of Hollywood. "Remember for me it's a new and exciting medium because I was not permitted to participate in it until now." She is not unwilling to discuss the past 20 years but she feels it is part of her past and hopefully over. "You might say I raised my children and did some touring theater," she explains with the trace of a smile, "it doesn't sound too bad that way."
Actually Gale's career began to flourish again a few years ago when she went back to her native Minnesota as a member of Tyrone Guthrie's celebrated company where she played the lead in a variety of productions including "The Visit." Then, after playing a cameo role in her husband's (director Herbert Biberman) film "Slaves," she agreed to return to Hollywood for producer Harold Clurman (she lives in New York) to appear in his production of "Uncle Vanya." "The part was such a small one, I asked Harold why he wanted to bring me all the way out there rather than hire a local actress but he insisted, so I went," she says. "I guess that brief local appearance in Hollywood reminded a lot of people that I was still around." Indeed it did. From "Uncle Vanya" and her actual presence in the movie colony again came roles in "Get Smart" and "It Takes a Thief." Apparently once these were seen on screen more and more people in the business remembered the highly competent and acclaimed actress and offers began to come in. An old friend of hers was doing the casting for "The Best of Everything" and the opportunity not only to act on TV but to act regularly, almost on a daily basis was so inviting that Miss Sondergaard happily signed. She rarely watches any of the 30 films she made when they are shown on TV but she seemed pleased to point out that "Anna and the King of Siam," which because of the musical version, "The King and I," was not released to TV until this season, was telecast the night after her "It Takes a Thief show was seen. "Frankly I enjoyed being all over the set. And I hope viewers saw how much better we did with 'Anna and the King of Siam' than the later musical version." Things are looking up for this lovely lady and one can only wish her the best of everything.
By
Paul Raven ·


Archived
This topic is now archived and is closed to further replies.